
- Scalability. The proposed methods allow using aggregated data (e.g., Netflow records), which makes them suitable for any complex and high-loaded networks.
- Sensitivity to changes in the distributions of traffic characteristics. The entropic approach helps respond to an anomaly and in situations where traditional traffic characteristics such as packets rate (rps) fail to detect meaningful anomalous behavior (i.e., attacks with low relative packets rate).
- Easy implementation and clear interpretation. Rapid availability, no need in data for training, and the ability to detect zero-day attacks.
Network Threads
The proposed entropy-based anomaly detection systems analyze network threads rather than individual network packets. We define network threads (hereinafter, the "threads") as unidirectional meta-information about network packets that have the same source and destination IP address and ports, as well as IP type. It is important to point out that all network activity in OSI Layer 3 and above is reduced to threads, i.e. this includes not only TCP connections, but also protocols without the state preservation, such as UDP and ICMP. Key advantages of using the concept of threads:
- This very easy in terms of using and storing information, which facilitates the analysis;
- They cause less problems in terms of privacy and personal data;
- It is easy to set up access to the required information on the network with Cisco NetFlow, sflow, or even IPFIX (whichever you prefer).
Entropy
In statistical physics and information theory, the concepts of entropy are fairly similar. In addition, an important fact when using entropy as a measure of traffic characteristics distribution is that the entropy also serves to measure how close the system is to its equilibrium state (in the theory of nonequilibrium processes, which can also describe the network traffic exchange). As many would remember, Shannon's classical definition of entropy states that:

where Pi -is the probability of the i-th state of the system, and n- is the number of all possible states of the system. To facilitate the interpretation of the result and exclude the impact of seasonal factors that change 'n', we will use the concept of normalized Shannon's entropy.
Picture 1

Network Traffic Attributes and Entropic Time Series
Now we need to explain exactly how we will make calculations (Picture 1) for different network traffic characteristics, and most importantly, for which ones. Different authors suggest using many different characteristics, but almost all papers mention the following basic set:
- Source IP
- Destination IP
- Source port
- Destination port
Sometimes, there are proposals to expand it with other characteristics, such as Flow Records or IP for backbone threads.
We will use the time series of Ho calculated for these traffic characteristics within finite-length time windows. Typical window (such windows may be overlapping or sliding) are about 5-10 minute long, given that an attack on the network infrastructure has a typical duration ranging within dozens of minutes. There is also a need in a fairly large amount of accumulated statistics. So, if we are interested in the entropy for the source IP address, then n is equal to the number of unique IP addresses in the window. As for calculating the probabilities, the overwhelming majority of authors use the number of packets with a given characteristic to measure the probability of such packet in the network (which is generally logical, but we can also use the number of bytes and the number of threads). For example, if we had 100 packets for 1.1.1.1, 100 packets for 1.1.1.2 and 300 packets for 2.2.2.2, then:


Next, we will discuss the attributes and situations when it makes sense to consider them for analyzing the attacks that we are interested in.
In most studies related to entropy and network anomalies, the researchers have focused on the source IP address and, therefore, its distribution and entropy. This is a rather good choice.
In one study [Sharma et al. (2015)], the authors experimented with various types of attacks and analyzed the usefulness of different attributes for detecting these attacks using an entropic approach. In particular, they used NUST data set to analyze the attacks, such as TCP-SYN flooding, UDP flooding, and Smurf. The analysis covered about 100,000 packets of normal traffic and 10,000 packets of attacked traffic. The attributes included Source IP, Destination IP, Source Port and Destination Port (standard), but the authors also considered Flags (distribution by TCP flag), Length (distribution by packet length), and Protocol (distribution by protocol).
They found that, in addition to the standard attributes, the anomaly detection systems based on entropic approach would benefit from using the additional attributes mentioned above, such as packet length (this showed very good results in case of TCP-SYN attacks). The use of entropy by protocol is relatively helpful, but it brings meaningful results only in specific cases, such as UDP flooding. However, these types of attacks can easily be detected by very traditional methods of traffic monitoring.
Algorithm for Network Anomaly Detection Based on Entropic Time Series
This method is a generalization of what is proposed by the authors [Winter (2011)]. The generalizations refer primarily to the selection of attributes for building a time-series system, as well as methods for identifying anomalies in specific time-series.
Algorithm
- Let's select the attributes for building the entropic time series. In [Winter (2011)], these are standard four attributes, including Src-Dst IP/Port plus distribution by flow records (1 flow records = Src IP + Dst IP + Src Port + Dst Port + IP Protocol);
- Now, let's build time series for normalized Shannon's entropies! We need to accumulate some statistics for the period covering the main seasonal factors of the network. In most cases, this can be limited to twenty-four hours. Let's define the set of series as T;
- Now for each time series we know the variance for the reference interval ( this is what we will call the interval for calculating the variance of the time series in the recent past). Starting at the subsequent points in time, our system is ready to detect the anomalies. qi is the standard deviation of the i-th time series from T;
- The basic idea of detecting abrupt changes is to continuously make short-term forecasts and identify the difference between the forecast and the actual value. Winter et al. (2011) propose a method of simple exponential smoothing, but nothing prevents you from taking something more complex (and accurate) ranging from ARIMA to LSTM networks.
For each Ti, we determine the forecast error for the point of interest t:

5. However, the individual forecast errors are not equally significant because the underlying time series have different variances. For that reason, we normalize the forecast errors relative to the variance of the corresponding time series by multiplying them by a weighting factor:

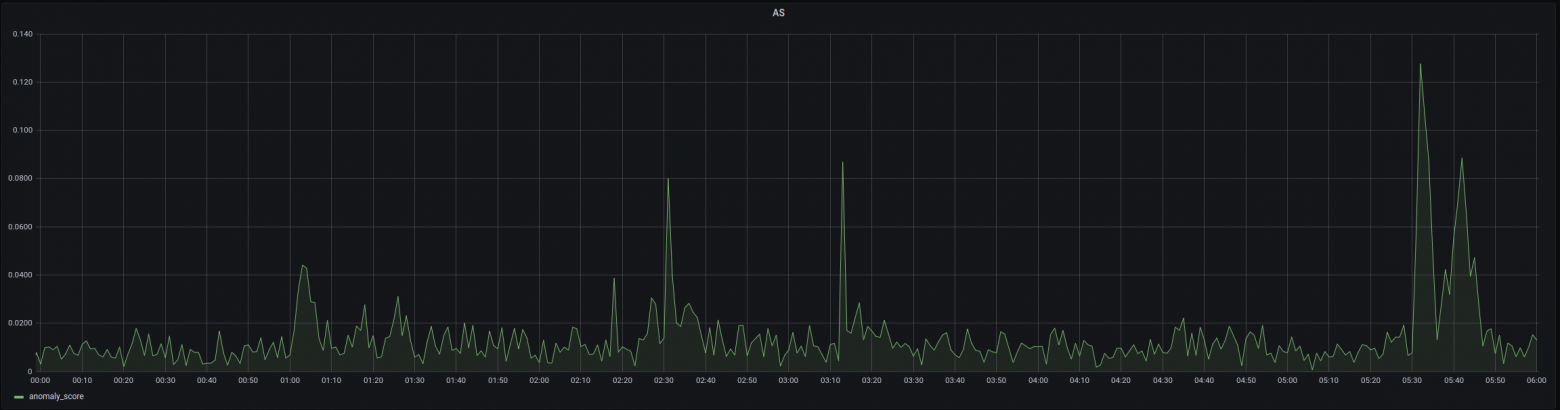
6. To simplify the anomaly detection process, we introduce an aggregate characteristic of " anomaly score":

7. If AS>ASthr, we say that we detected a certain network traffic anomaly. The threshold value ASthr is determined empirically depending on the number of base time series n, as well as the requirements for the sensitivity of the detector.
How to Configure Parameters
For our algorithm, we need to set a number of parameters. Each combination of parameters implies a trade-off, as high detection rate is achieved at the cost of many false positives, or vice versa.
- Sliding Window Length. This is about the size of the interval used to calculate the point values of the entropic time series. Small windows are very sensitive. On the one hand, this will improve the detection rate but, on the other, there will be also more false alarms. Big windows are relatively insensitive, which has the opposite effect. As a compromise solution, we can use the windows that are 5 to 10 minutes long;
- Size of Sliding Window Overlap. The overlap of sliding windows leads to more granular time series. We want that our system responds as quickly as possible to abrupt changes, so we chose a relative overlap of 80%;
- Sliding Window Size for Variance Calculation. To calculate the standard deviation, we decided to set the sliding window size to 24 hours. Most often, such sliding window covers the entire seasonal cycle. In other cases, we recommend to select windows in multiples of 24 hours. A natural alternative would be 7 days.
Further Modifications
Bhuyan et al. (2014) investigated a set of information metrics to find out whether they can be applied for anomaly detection using similar methods. In addition to the already mentioned and well-known Shannon's entropy, they tested the concepts of Hartley's entropy, Renyi's entropy, and Renyi's generalized entropy. These are the generalizations of Shannon' entropy that can be defined by the following formula:


The authors reach the following conclusions:
- It is important to use a minimum number of traffic attributes. Most often, these will be IP addresses or packet lengths;
- information entropy gives the best results in detecting low-speed attacks with large values of a.
Outcomes
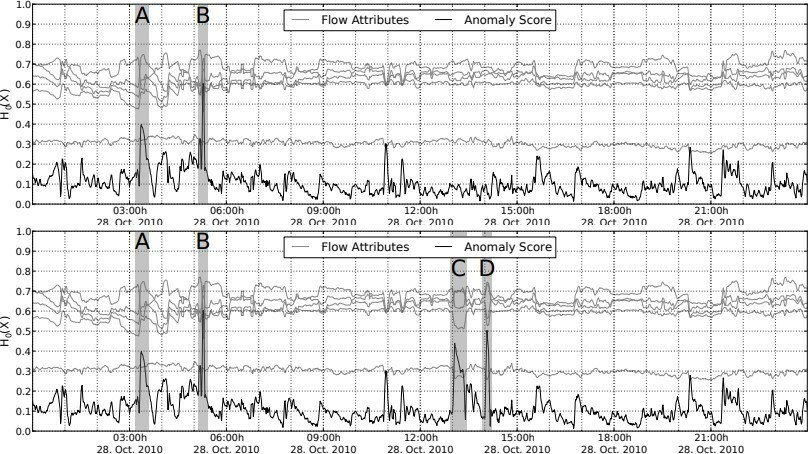
Since Winter et al. (2011) had no real data for validation, they modeled and implemented synthetic anomalies into the original data set. To do this, they used a modified version of the FLAME tool created by Brauckhoff et al. (2008), which facilitates the introduction of artificial anomalies into the thread data. The authors implemented two such "thread generators":
- HTTP flood: The generated threads are artificial HTTP requests. The attack lasted 11 minutes from a total of 500 distributed hosts used by the "attackers." The attack targeted a single web server. The number of threads generated by the attackers represents a normal distribution, since not all attackers can use the same bandwidth. The web server was under very high load and could respond only to a small fraction of HTTP requests. The attack resulted in 220,000 threads that were added to the original data set (C);
- Horizontal network scan: The purpose of this generator was to produce threads that represent a large-scale horizontal scan of the network. The attacker used a single IP address to scan the entire /16 network, which includes 65,534 valid IP addresses. The scan was aimed at finding open TCP ports 21, that is, FTP ports. The attacker did not use obfuscation techniques such as delays between scans. The scan yielded 67,000 threads. Note that the worm epidemics are very similar to such network scan (D).
The figure below shows the entropic analysis for the entire day of October 28. The upper diagram shows the original data set, while the lower diagram presents our added anomalies (C and D). Again, both diagrams contain time series for all five attributes. The time series for presented in black is the most interesting. In both diagrams, we highlighted particularly strong anomalies and labeled them from A to D. A and B represent "natural" anomalies that were already present in the original data set.
To illustrate how all this can remain undetected by traditional monitoring tools, the figure below shows three popular traffic statistics, including the number of bytes, packets, and threads per minute for the same traffic as in the previous example. The anomalies ( labeled from A to D) vanish in the noise.

A similar experiment was conducted in ENFINT, the only difference was that the anomalies were "natural," i.e. they were already present in the customer's data.
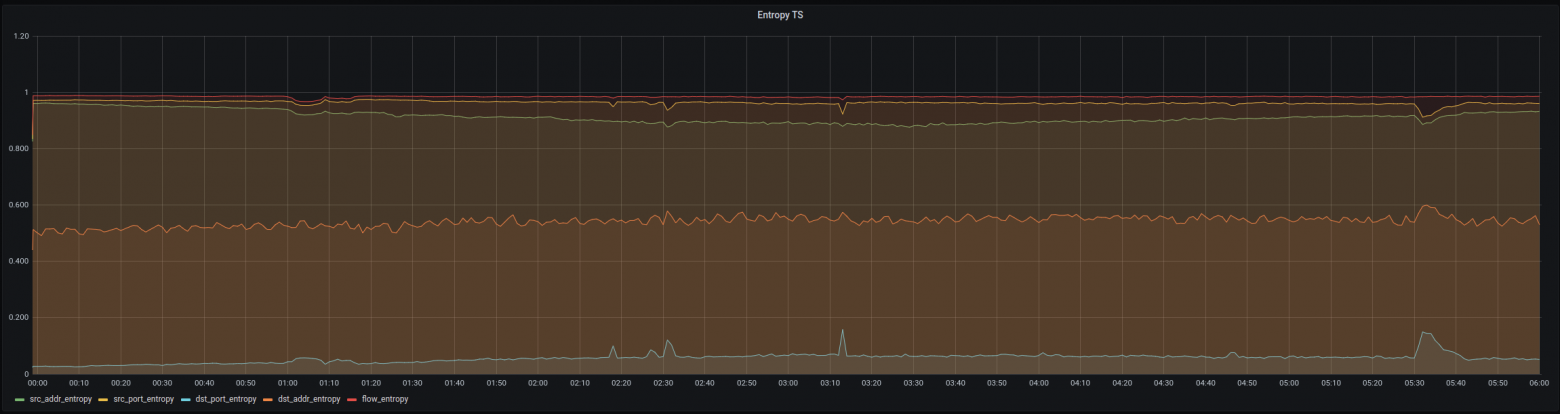
For comparison, these are the standard dashboards of routers for network traffic monitoring over the same period:
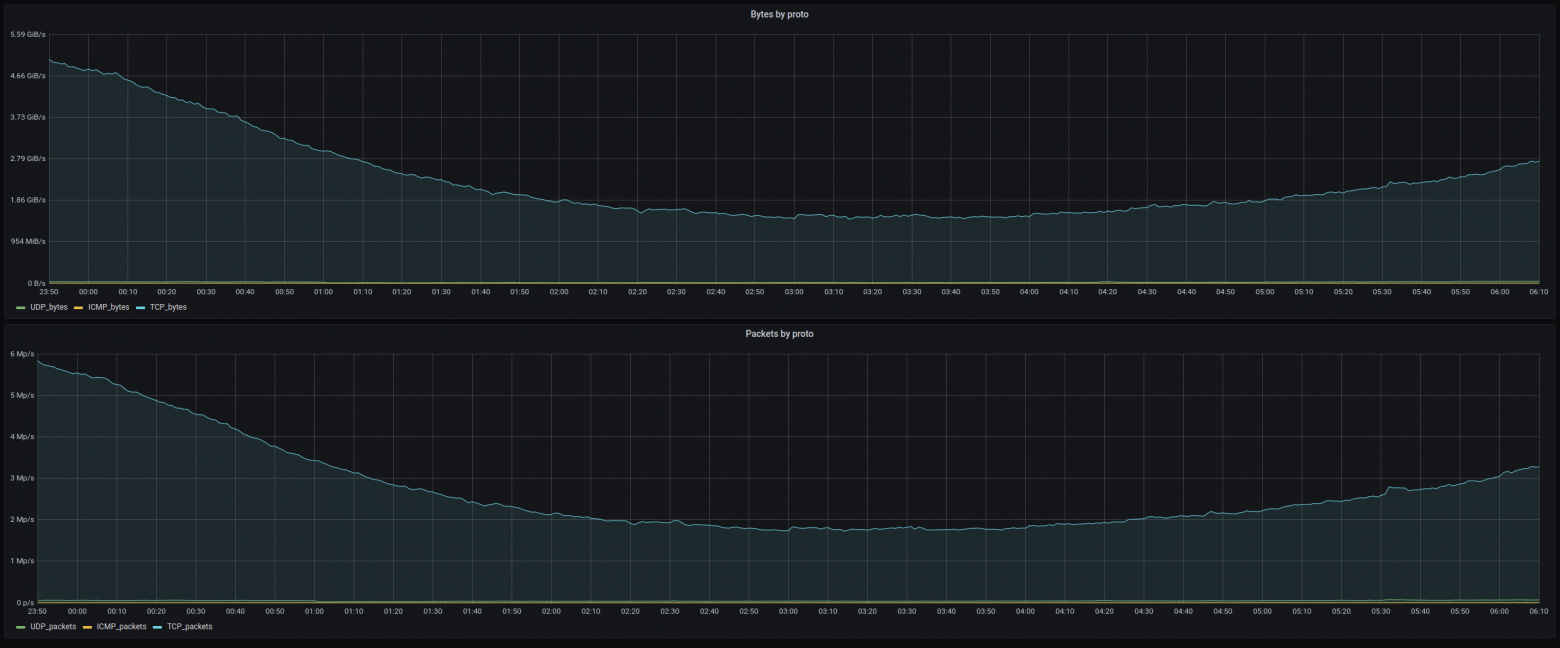
As we can see, there are quite significant deviations in the distribution of network traffic characteristics that remained unnoticed with the standard metrics. The issue of using the acquired data to identify the causes of these anomalies is the topic of a separate discussion. We would like only to mention that searching for a group of values in characteristics, which significantly changed the entropy, can be reduced to studying the dynamics in the distribution of these characteristics and, in simple cases, this can be done with regular sorting by Pi probabilities.
Summing Up
We have implemented and tested an algorithm for detecting a wide class of network anomalies through entropic time series. The attacks such as various kinds of flooding, worms, and scanning often cause these kinds of anomalies. The basic idea behind the algorithm is to continuously make short-term forecasts and identify the difference between the forecast and the actually observed value of the entropy. The entropy serves as an indicator describing the equilibrium of the process. Therefore, the dramatic changes in entropy indicate a qualitative shift in the structure (through changes in the distributions of characteristics) of the system. Importantly, the attacks must still reach a certain scale in order to be detected. Attacks that are really small-scale can remain invisible on a high-speed network connection. We believe that such algorithms are a valuable tool for network operators and information security departments across a wide range of enterprises. It can be easily configured, quickly deployed, and requires no data for training.
References
Philipp Winter, Harald Lampesberger, Markus Zeilinger, and Eckehard Hermann 2011. “On Detecting Abrupt Changes in Network Entropy Time Series”
Sidharth Sharma, Santosh Kumar Sahu, Sanjay Kumar Jena 2015. “On Selection of Attributes for Entropy Based Detection of DDoS”
Monowar H. Bhuyan, D. K. Bhattacharyya, J. K. Kalita. “Information Metrics for Low-rate DDoS Attack Detection: A Comparative Evaluation”
Brauckhoff, D., Wagner, A., May, M.: “FLAME: A Flow-Level Anomaly Modeling Engine”. In: Proc. of the conference on Cyber security experimentation and test. pp. 1 – 6. USENIX Association, Berkeley, CA, USA (2008)